The Problem
Our team is small enough that everyone touches everything. Designers build levels. Artists set up lighting. Nobody has the luxury of waiting for an engineer to audit performance before a merge.
But profiling has always been a bottleneck (pun intended). It's not that our non-technical staff don't care about performance — they do. It's that the tools speak a language they never learned. What's a set-pass call? When is 3.8 GB of tracked memory "too much"? Why does the profiler itself inflate the heap? These are things that take years to internalize.
So the pattern was always the same: someone builds a level, it runs at 15 FPS, it gets flagged in QA (if we're lucky), then an engineer spends a day in the Profiler tracing it back to 295 shadow-casting lights or a batch of uncompressed audio files that got shipped with a feature three patches ago.
That last one actually happened. We had a set of radio audio tracks — uncompressed, loaded fully into memory — that had been sitting in the build for weeks. QA didn't catch it. The dev team didn't catch it. It took an AI reading a memory breakdown table to surface it.
That's when I knew this tool was worth finishing.
What It Does
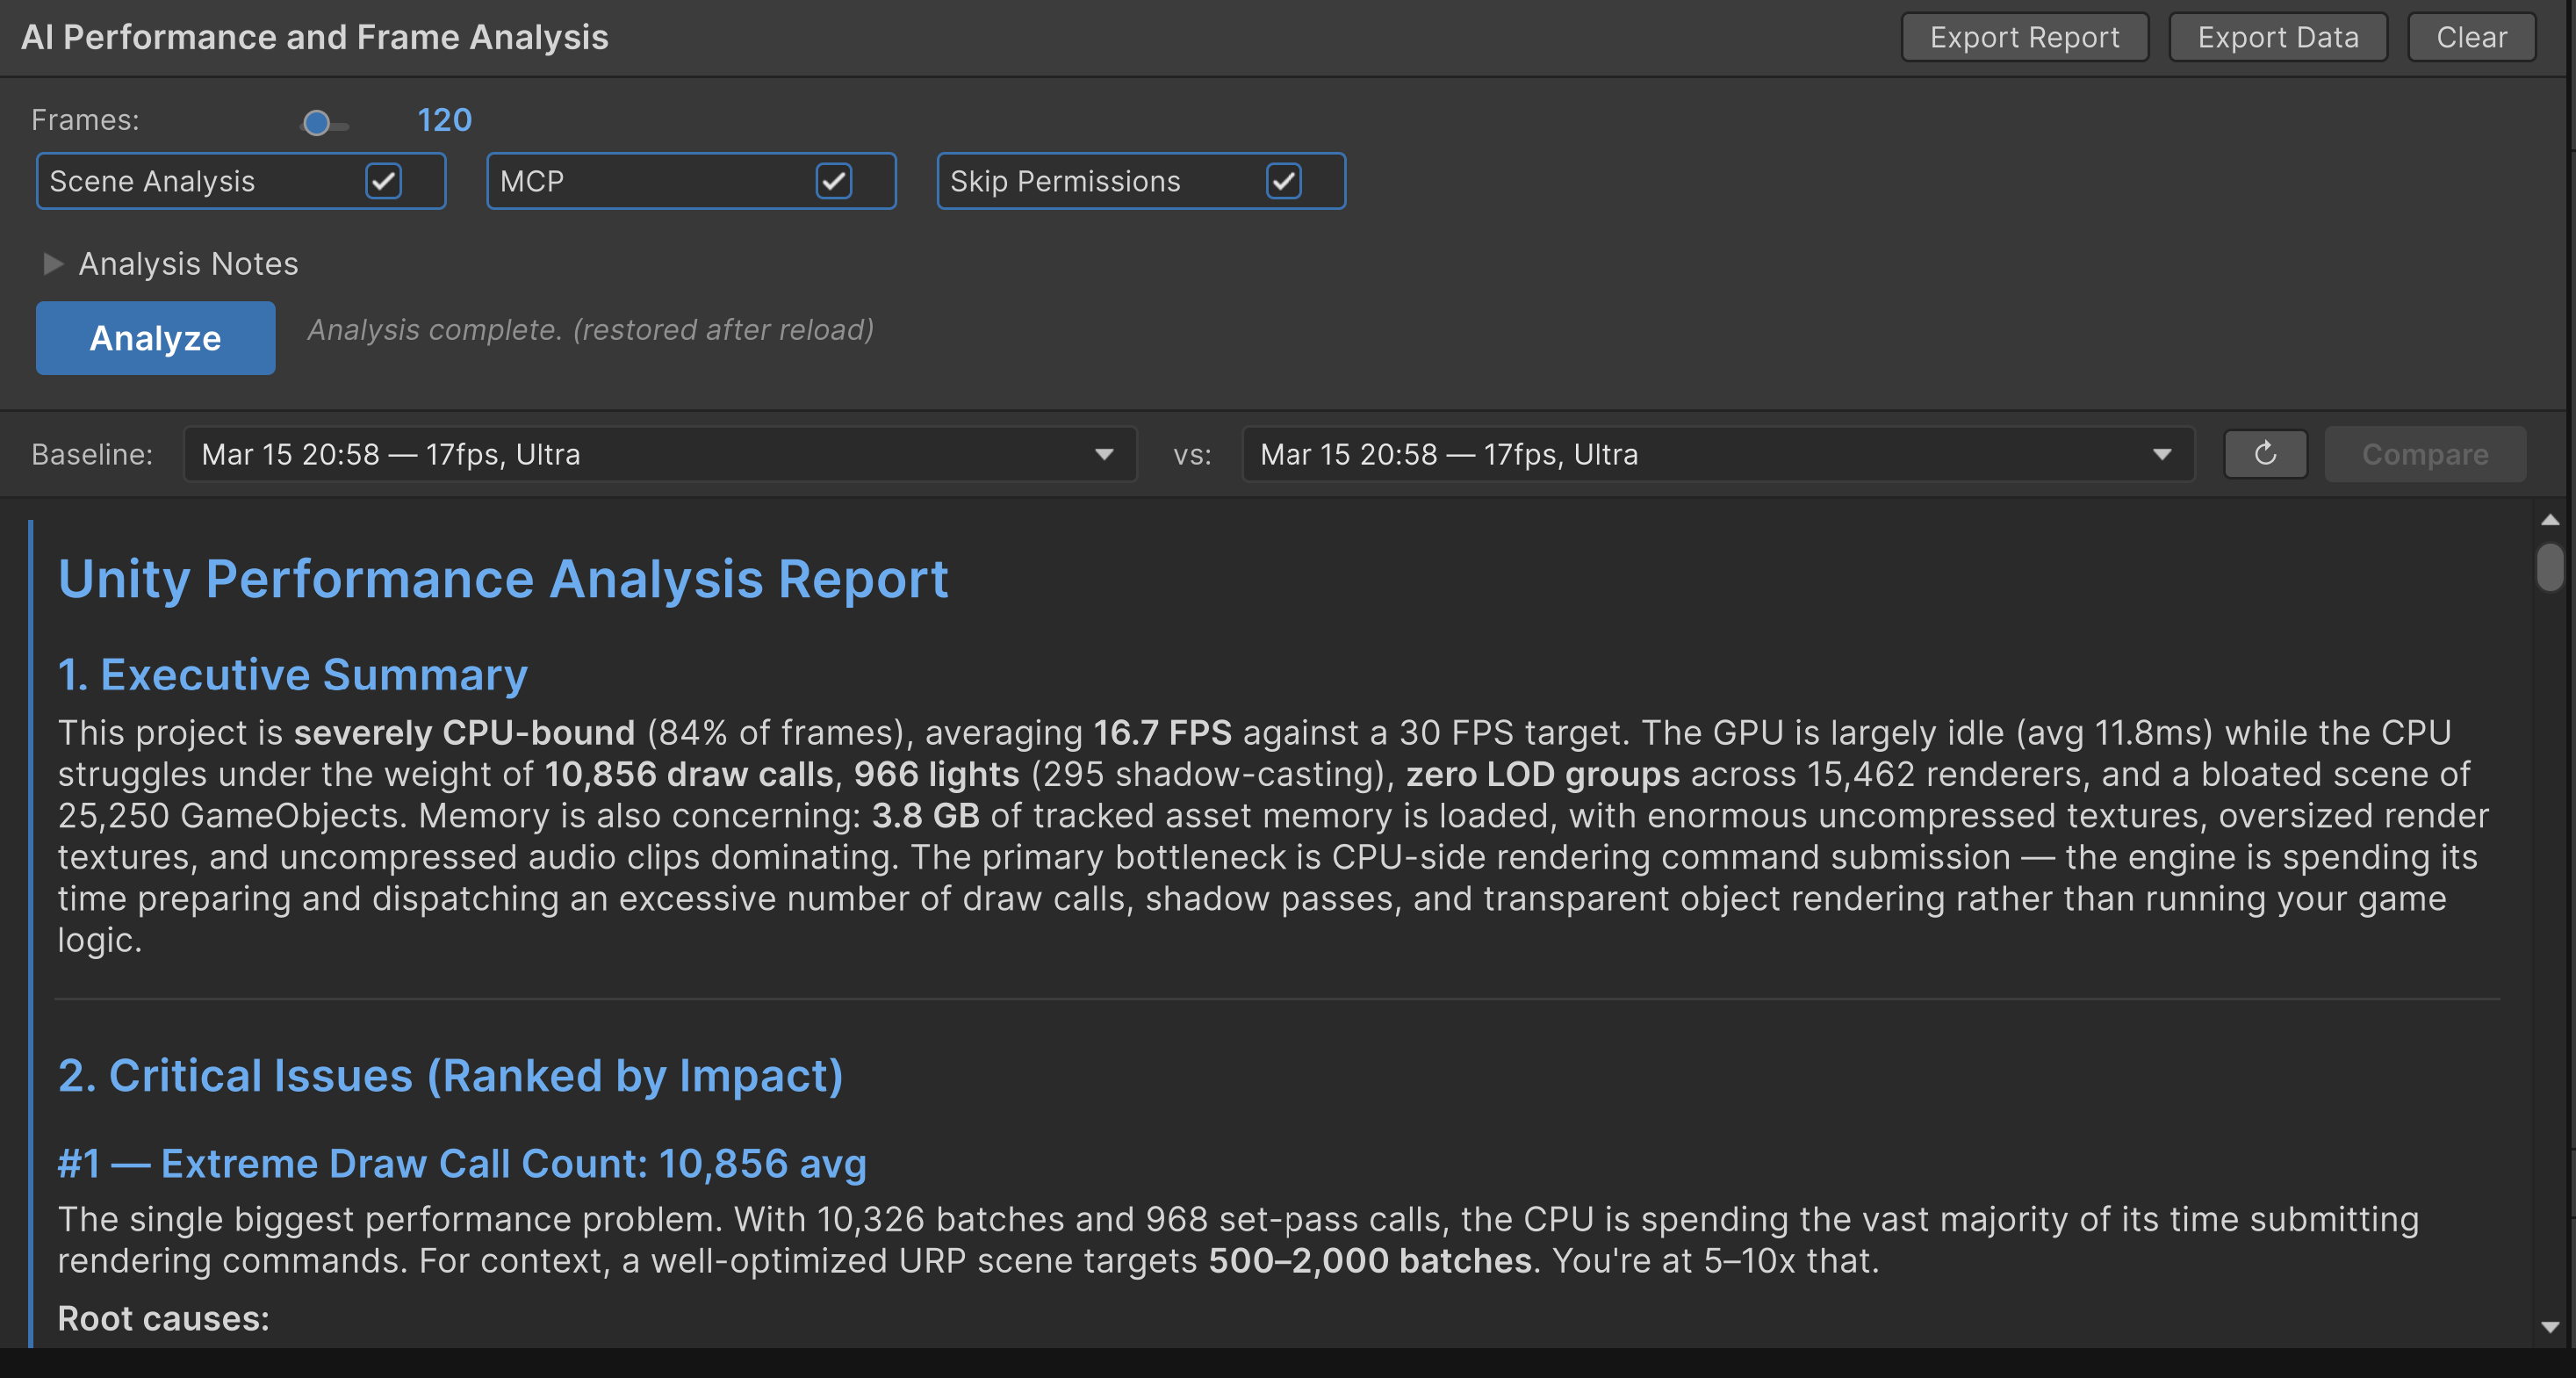
Frame Analyzer is a Unity Editor window. You open it, you hit Analyze, and it does everything else.
Behind that one button:
- Captures 30–600 frames of live Play Mode data — CPU timing, GPU timing, memory, rendering stats, URP render pass breakdown, per-method profiler hierarchy, and GC allocations. All of it.
- Scans the active scene — hierarchy depth, component counts, LOD coverage, material/shader inventory, SRP Batcher compatibility, static flags. Things that experienced developers check manually, automated.
- Catalogs every loaded asset in memory — every Texture2D, Mesh, AudioClip, Shader, Material, and ScriptableObject currently resident. Sorted by size. The 4096x4096 uncompressed UI texture hiding in your build? It shows up.
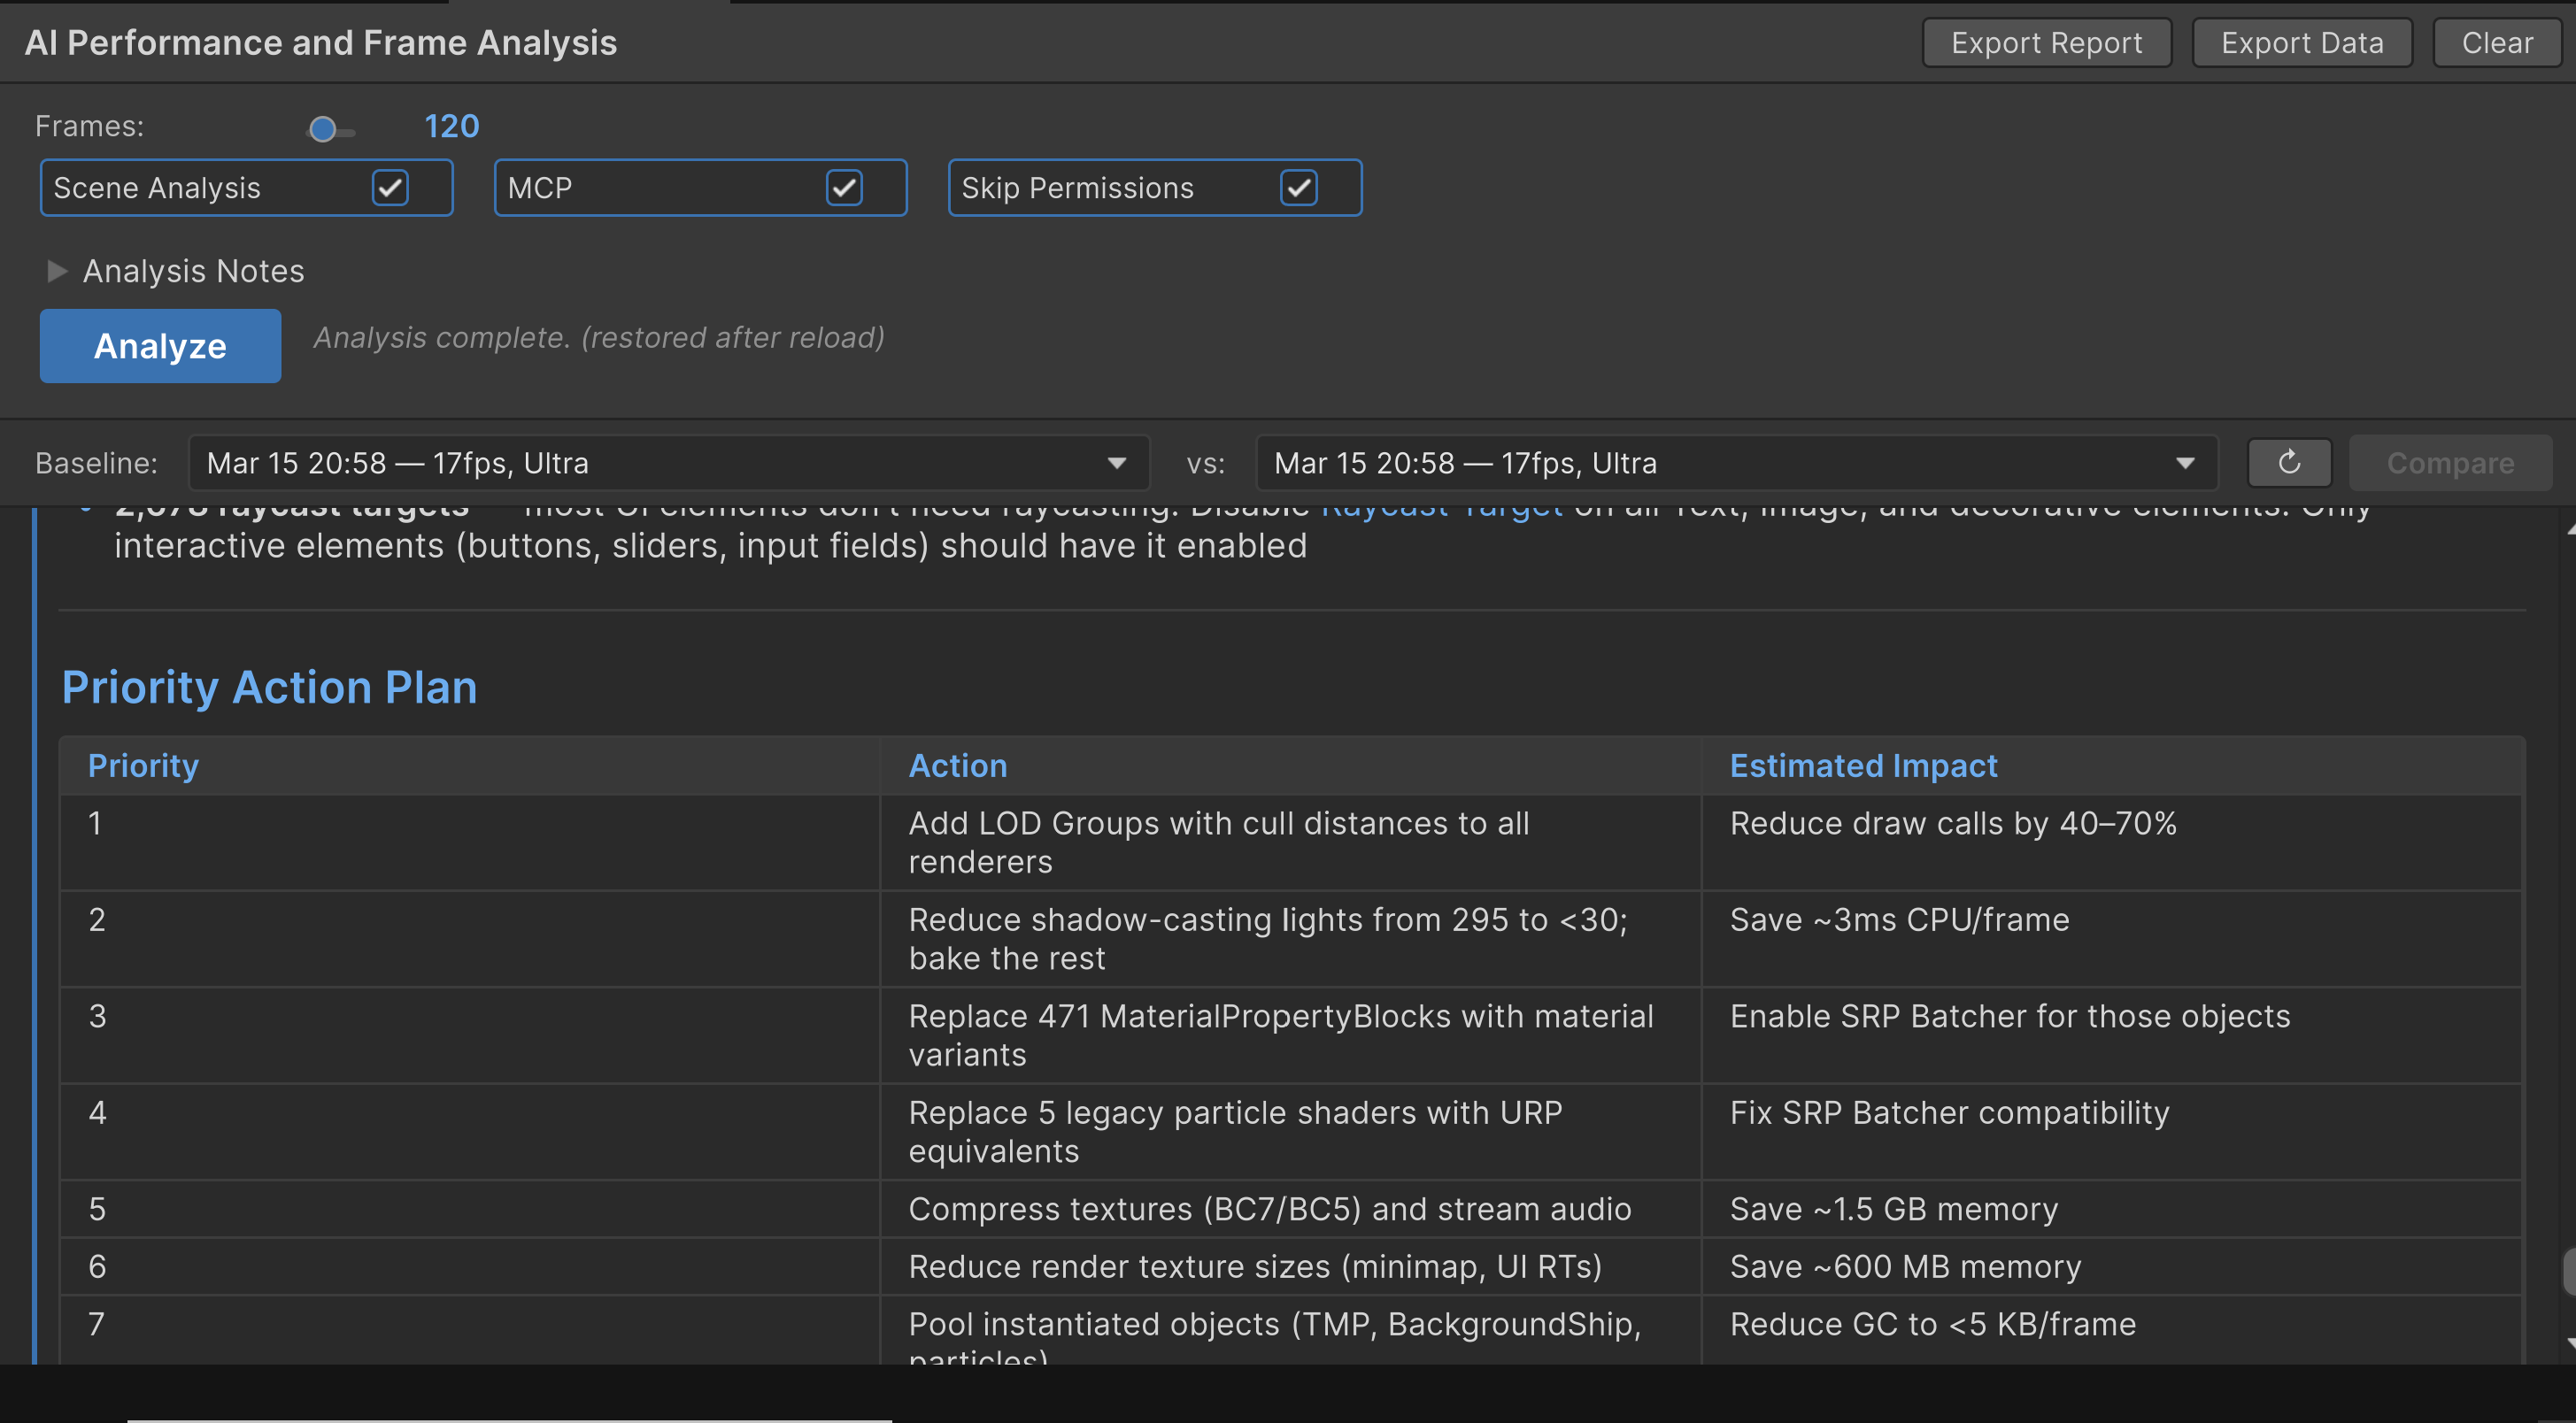
- Sends everything to Claude in a single prompt, streamed back in real time with a detailed report: executive summary, critical issues ranked by impact, per-method script hotspots, rendering analysis, memory analysis, GPU bottleneck classification, and a prioritized action plan.
No profiler expertise required. No alt-tabbing. No copy-pasting frame data into a spreadsheet.
Session Comparison
Run it before your changes. Run it after. Pick two sessions from the dropdown, hit Compare, and get a side-by-side analysis: what improved, what regressed, what stayed the same. Written in plain language. Our designers use this to validate their own optimizations without waiting for engineering sign-off.
Notes Field
A small thing that turned out to matter a lot. There's a text field where you can write context: "ignore the loading spike at frame 1," "focus on draw calls," "I know the shadows are expensive, I'm working on it." Claude reads these and respects them. It won't yell at you about something you've already accepted.
Claude Code Bridge
If you're already running my Claude Code CLI extension inside Unity, you can push the raw capture data straight into the CLI window with one click. From there, you can have an interactive conversation about the results — ask follow-up questions, drill into specific methods, or get Claude to help you actually write the fix. The analysis becomes the starting point, not the end.
Under the Hood
The architecture is a Unity package (com.tonythedev.frame-analyzer) split into Runtime and Editor assemblies.
The Collector Pattern
Data capture uses a simple IFrameDataCollector interface. Each collector is responsible for one metric family:
- CpuTimingCollector — PlayerLoop, Update, LateUpdate, FixedUpdate, Rendering, Physics, Animation, GC.Collect. Uses
ProfilerRecorderfor low-overhead marker recording. - GpuTimingCollector — CPU and GPU frame time via
FrameTimingManager, plus main thread vs render thread breakdown. Classifies each frame as CPU-bound, GPU-bound, Present-Limited, or Balanced. - UrpPassCollector — Timing for ~40 URP render pass markers. Tells you exactly which stage is expensive: DrawOpaqueObjects, MainLightShadow, Bloom, SSAO, the works.
- MemoryCollector — Managed heap, GC allocation bytes and count per frame.
- RenderingStatsCollector — Batches, draw calls, set-pass calls, triangles, vertices, shadow casters. Straight from
UnityStats.
A CaptureOrchestrator ticks them all each frame and accumulates the results into a CaptureSession. After capture completes, two post-processing passes run:
ProfilerHierarchyAnalyzer reads back the Profiler's recorded frames via ProfilerDriver.GetHierarchyFrameDataView and extracts per-method statistics: median self-time, GC allocation bytes, call counts, P95, standard deviation. This is the same data you'd get expanding the Profiler hierarchy tree manually — but across every captured frame, aggregated, and sorted.
MemoryBreakdownAnalyzer enumerates every Unity Object in memory via Resources.FindObjectsOfTypeAll, categorizes by type, and measures each one with Profiler.GetRuntimeMemorySizeLong. The top 30 largest individual assets get called out by name, dimensions, format. This is how it catches that 4K uncompressed texture you forgot about.
The Claude Integration
The prompt pipeline is deliberately simple. AnalysisPromptBuilder assembles a single string: an expert system prompt (covering URP optimization, SRP Batcher rules, GC patterns, profiler overhead caveats), the raw captured data, the user's notes, and structured instructions for the report format.
ClaudeProcess spawns a claude subprocess with --output-format stream-json, pipes the prompt to stdin, and parses the streaming JSON output line by line. The UI renders the response in real time using a custom MarkdownRenderer built on UIElements — headers, lists, tables, code blocks, the whole thing, styled with Catppuccin Mocha because dark themes aren't optional.
When MCP is enabled, Claude gets up to 3 turns and can query the Unity scene through the MCP server — inspecting specific GameObjects, checking material settings, grabbing screenshots. Without MCP, it's a clean one-shot: data in, report out.
Statistical Rigor
Session summaries compute min, max, average, median, P95, P99, and standard deviation for key metrics. Median over mean was a deliberate choice — profiler data is full of outliers (GC spikes, scene load frames), and median gives you a more honest picture of typical frame performance. Spike detection flags any frame exceeding 2x the average.
What I Learned
The Profiler is the bottleneck, not the project. The biggest hurdle for non-technical users was never the data — it was the interface. The Profiler gives you everything, but it gives you everything. There's no hierarchy of importance. A 0.01ms method sits next to a 15ms method and they look the same until you sort. Frame Analyzer's job isn't to replace the Profiler — it's to be the first pass that tells you where to look.
Profiler overhead is confusing and real. The profiler itself adds 50–200+ MB to the managed heap and 0.5–2ms per frame. If you don't account for that, every report starts with "your memory usage is critically high" when it's actually just the profiler recording itself. The agent prompt explicitly teaches Claude about this, so it focuses on relative costs and per-frame allocations rather than absolute heap size.
The notes field changed everything. I almost didn't add it. Turns out, the difference between a useful report and an annoying one is whether it respects what you already know. Engineers don't want to be told about the shadows they're intentionally baking. Artists don't want to be told about the shader they can't change. One text field fixed that.
One-shot is the right default. I initially built this with interactive follow-up in mind — multi-turn conversations inside the editor window. But the one-shot model turned out to be what people actually want. Click, wait, read. If you need to dig deeper, push it to the CLI. Most of the time, the first report is enough to know your next three moves.
Why This Matters
Unity has ~30% of the global game engine market. Millions of people use it. A meaningful percentage of those people are artists, designers, audio engineers, and producers who touch the editor every day but don't have a rendering engineering background.
Performance optimization shouldn't be a priesthood. The data is already there — Unity captures it, stores it, exposes it through well-documented APIs. What was missing was a layer that collects it all at once, reads it with expertise, and translates it into language that anyone on the team can act on.
Frame Analyzer is that layer. For senior engineers, it's a fast first pass before digging into the Profiler manually. For everyone else, it's the first time performance analysis is something they can do themselves, on their own terms, without waiting for someone else to interpret the numbers.
That matters. When your environment artist can run a performance check, read "add LOD Groups — reduce draw calls by 40–70%," and do it themselves? That's not just faster. That's a team that scales.